Define Your Service Level Objectives
Service Level Objectives with Sloth
Section titled “Service Level Objectives with Sloth”Sloth enables you to define and manage Service Level Objectives (SLOs) efficiently.
To begin defining SLOs, create a PrometheusServiceLevel resource by specifying queries and objectives.
If these objectives are not met, Prometheus will trigger corresponding alerts.
Here is an example configuration:
apiVersion: sloth.slok.dev/v1kind: PrometheusServiceLevelmetadata: name: sampleapp-slospec: service: external slos: - name: sampleapp-available objective: 99.0 description: "The sampleapp app should serve requests without errors 99% of the time" sli: events: errorQuery: sum(rate(nginx_ingress_controller_requests{host="sampleapp.ref+file://config.yaml#/ingress/domainName+",status=~"(5..|429)"}[{{.window}}])) totalQuery: sum(rate(nginx_ingress_controller_requests{host="sampleapp.ref+file://config.yaml#/ingress/domainName+"}[{{.window}}])) alerting: name: SampleAppNotAvailable labels: category: availability annotations: summary: "https://sampleapp.ref+file://config.yaml#/ingress/domainName+/ is not available"Validate integration
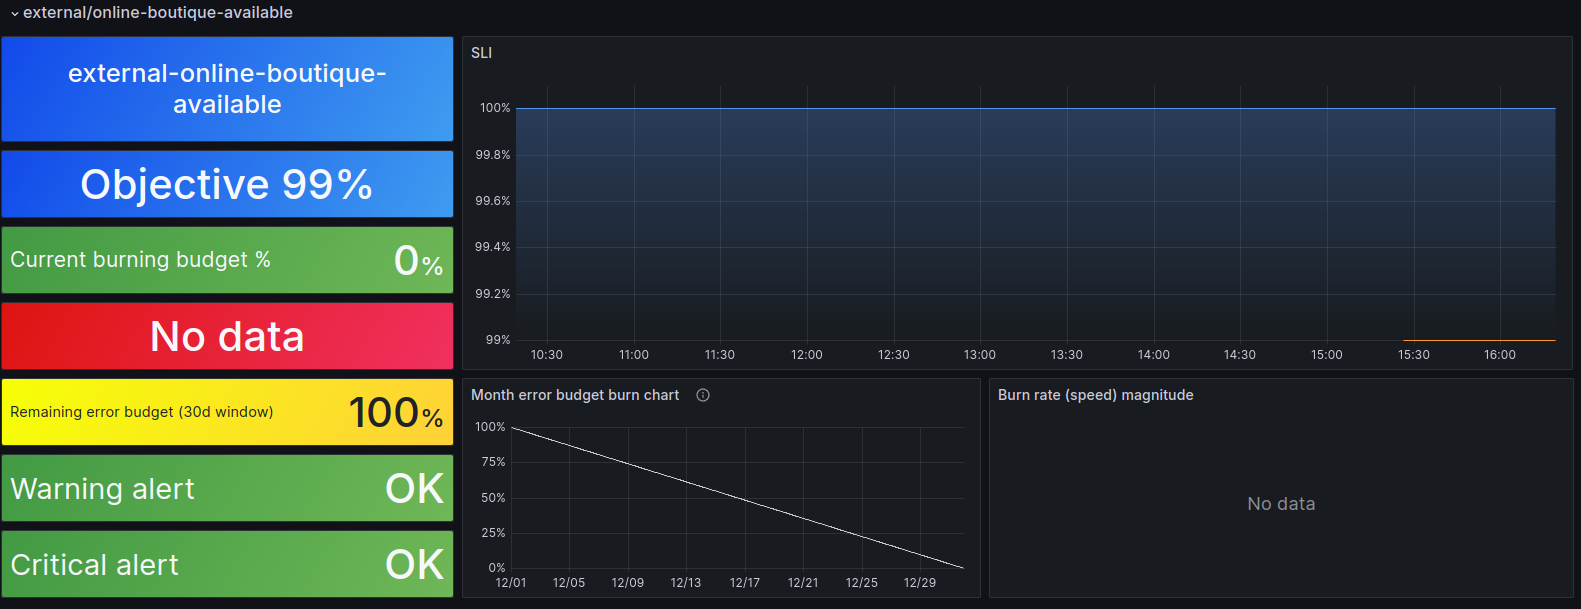
Section titled “Validate integration”To ensure your integration is successful, navigate to the alerts list in your Grafana UI or the “Sloth - SLO / Detail” dashboard. Here, you can access the global SLO list, including your newly created SLO.