Monitor your app
Metrics
Section titled “Metrics”You can export your application’s metrics by creating a ServiceMonitor that watches your Service.
The ServiceMonitor observes all services that match the specified selector.
For example, the following ServiceMonitor monitors all services with the label app: sampleapp.
apiVersion: monitoring.coreos.com/v1kind: ServiceMonitormetadata: name: sample-servicemonitorspec: selector: matchLabels: app: sampleapp endpoints: - port: httpTracing
Section titled “Tracing”Tracing is enabled with Tempo.
This tool will be able to receive all the sent traces and supports OTEL (OpenTelemetry).
To send your traces, direct them to tempo.k8saas-system.svc.cluster.local.:4317.
Traces can be found in Grafana. Use “Explore”, then find “Traces”.
Application logs are collected by default using the Logging Operator.
You do not need additional configuration to collect your application’s logs, as all application logs are automatically captured.
Logs can be found in Grafana. On “Dashoards”, find the loki/logs one.
Custom dashboard
Section titled “Custom dashboard”To provision a Grafana Dashboard using a declarative way,
create a ConfigMap with the grafana_dashboard: "1" label containing the dashboard JSON manifest.
apiVersion: v1kind: ConfigMapmetadata: name: sampleapp-dashboard labels: grafana_dashboard: "1"data: sampleapp-dashboard.json: | { ... }Predefined Metrics
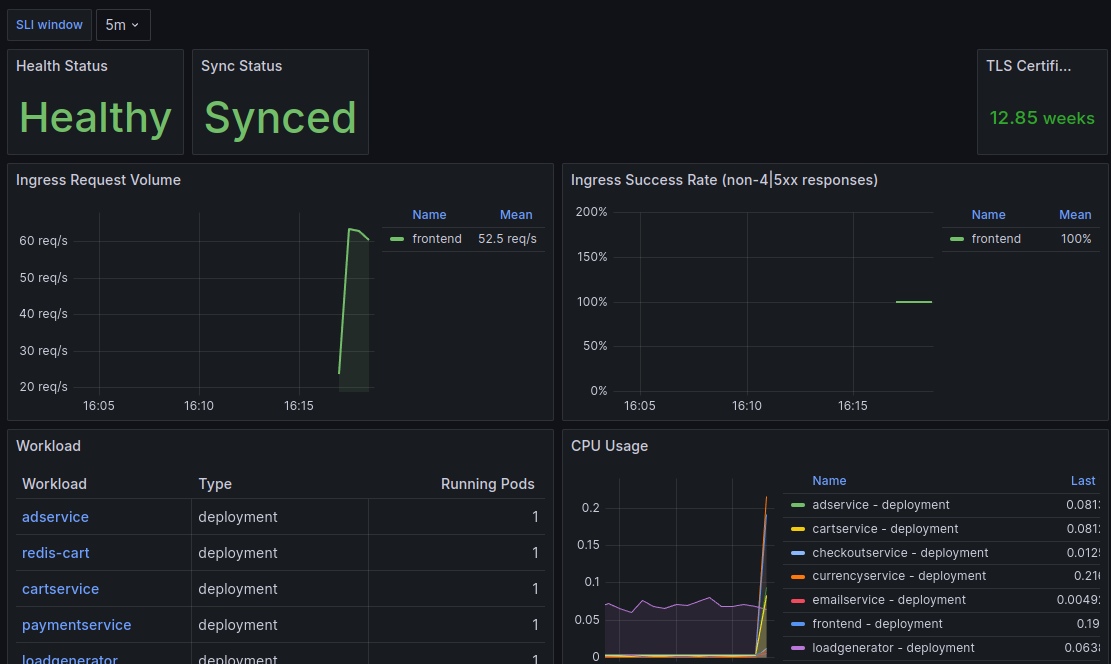
Section titled “Predefined Metrics”Some metrics are exposed by default, such as certificate status and ingress requests. For a detailed example of a dashboard exposing various metrics, check out this dashboard YAML example.
Alerting
Section titled “Alerting”By creating a PrometheusRule, you can create alerting rules when your applications meets your desired requirements.
This alert is fired if the there is less than 2 ready replicas for the “application-api” deployment.
Make sure to create an according AlertmanagerConfig in order to let fire alerts based on this rule.
apiVersion: monitoring.coreos.com/v1kind: PrometheusRulemetadata: name: application-api-down-rule labels: release: monitoringspec: groups: - name: "application.rules" rules: - alert: ApplicationAPIDown for: 1m expr: kube_deployment_status_replicas_ready{deployment="application-api"} < 2 labels: severity: critical app: application-api annotations: message: The API deployment has less than 2 pods running. summary: the current deployment "application-api" need to have at least 2 replicas runningValidate integration
Section titled “Validate integration”To validate your monitoring integration, navigate to the Grafana UI and locate the relevant dashboard. Ensure the selected data aligns with your monitoring configuration and is being successfully scraped.